Re-Presenting Data

IDENTIFYING TOPICS OF NEWS HEADLINES
Topic Modeling of News Headlines from January 2020 to December 2020

Visual Analytics Assignment
Exploring and Protoyping visualizations methods for Understanding News Corpus.
Dataviz Makeover 3
Visualisation Makeover on spatio-temporal analysis of conflict in South-East Asia using Tableau
Dataviz Makeover3
Mapping armed conflict in South-east Asia in the last decade (Jan 2010 to Oct 2020)
Visual Analytics Project Proposal
Understanding Key Stories Covered In the Media and How Readers Engaged With News
Dataviz Makeover 2
Re-imagining YouGov's survey on attitudes and opinions towards COVID-19 vaccination.
Dataviz Makeover 2
Visualisation Makeover on public willingess to take Covid-19 Vaccine in Tableau

Dataviz Makeover 1
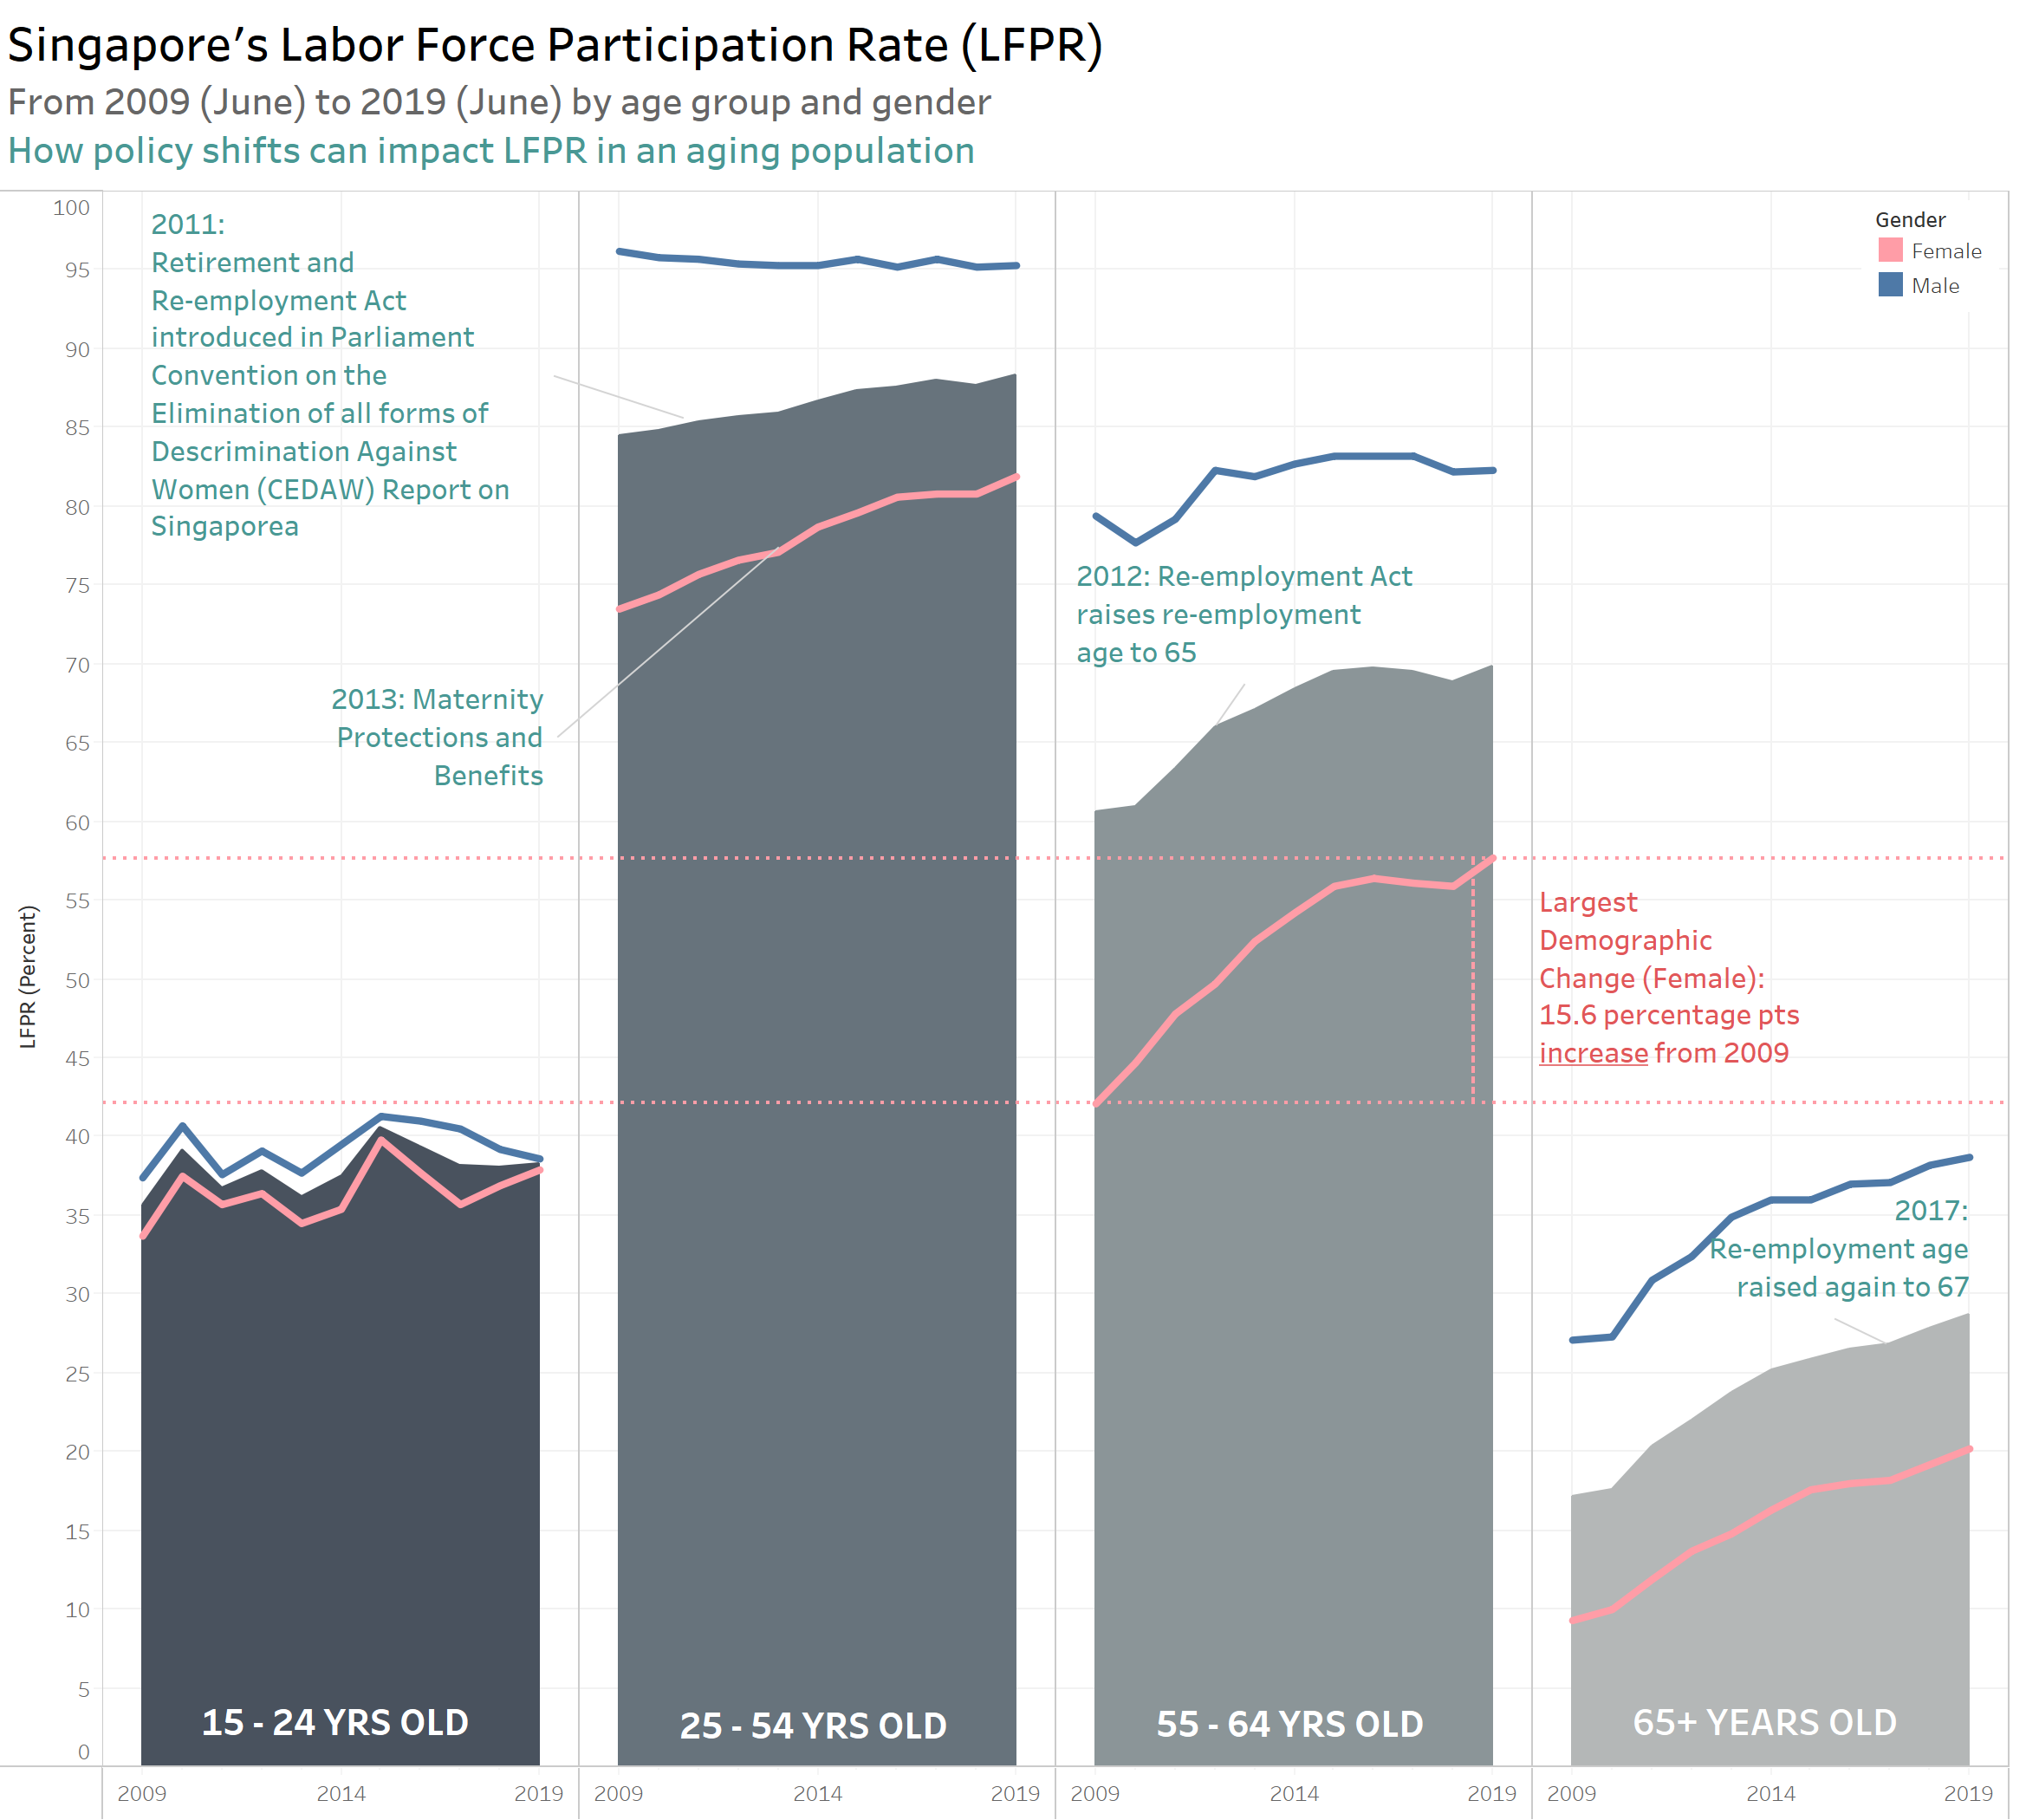
Re-imagining MOM's Labour Force in Singapore 2019 Report in Tableau
Dataviz Makeover 1
Visualisation Makeover on MOM's Labour Force in Singapore 2019 Report in Tableau
Re-presenting Data
The world forgetting by the world forgot. Eternal Sunshine of the Spotless Mind!